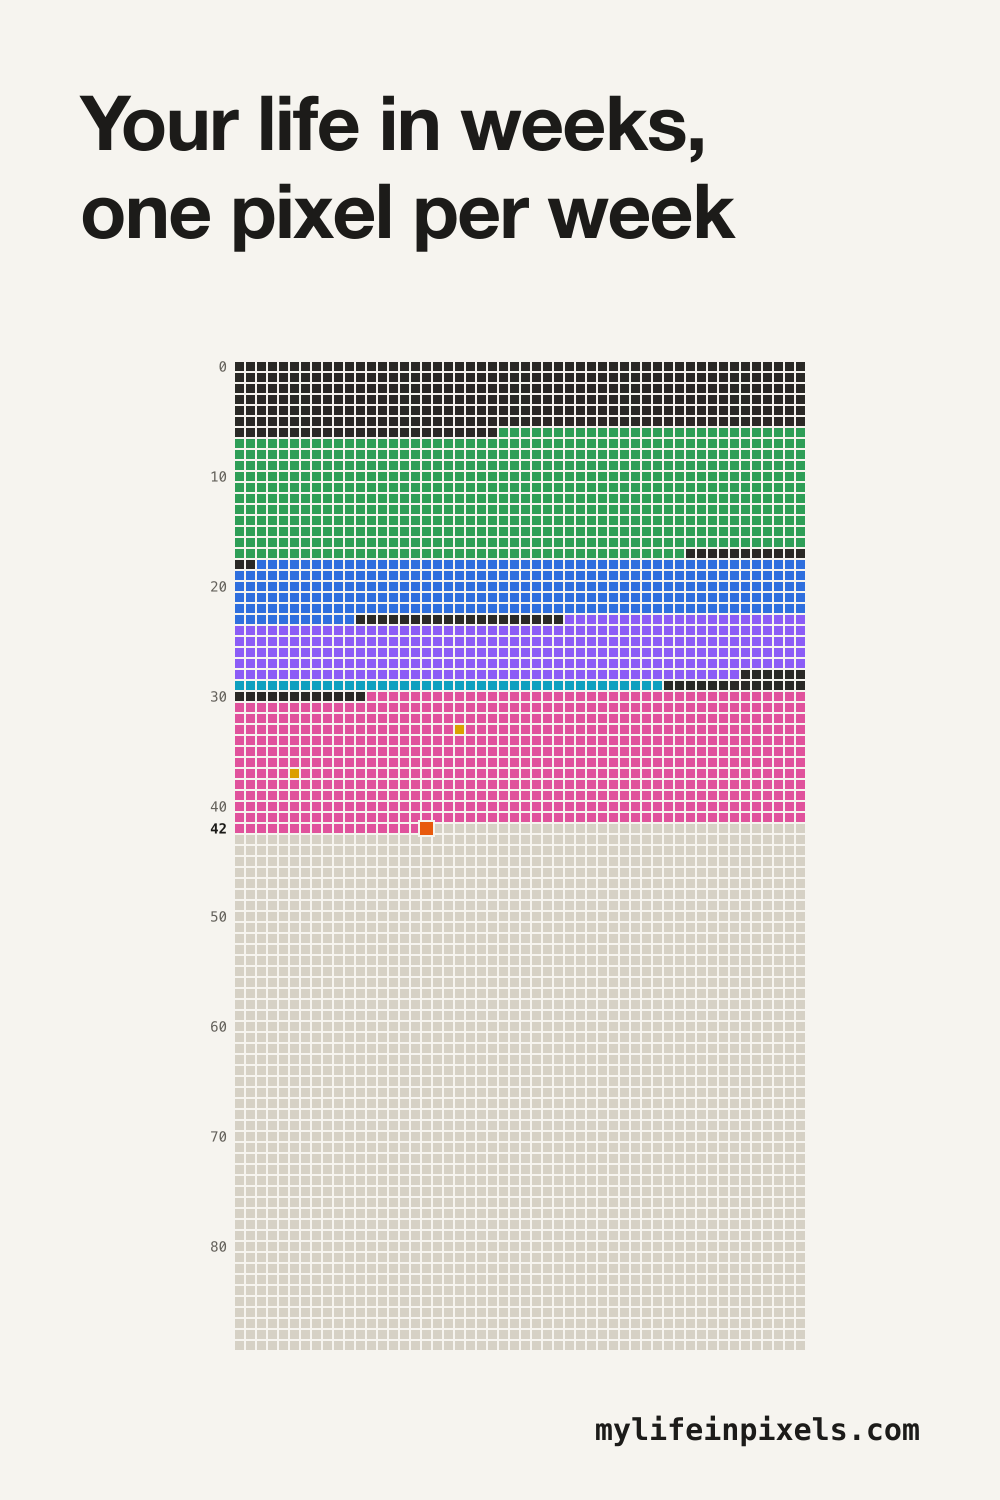
My Life in Pixels is a free web app that shows your entire life as a grid of weeks, one pixel per week.
A life of 90 years is 4,680 weeks. Enter your date of birth and the grid above fills in the weeks you have lived, marks the current week and leaves the rest open. Color in your studies, jobs, relationships and moves, then share the result as a link or a PNG. Nothing leaves your device.
What is a life calendar?
A life calendar is a single picture of an entire human life, drawn as a grid in which every box is one week. Each row is one year of life, from birth at the top to old age at the bottom. The weeks you have already lived are filled in; the weeks ahead of you are still empty.
The idea became widely known through “Your Life in Weeks”, a 2014 essay by Tim Urban on Wait But Why. Oliver Burkeman’s book “Four Thousand Weeks” (2021) made the number itself famous: 4,000 weeks is roughly 77 years, about the length of an average life.
How does My Life in Pixels work?
You enter your date of birth as a day, a month and a year. The grid appears right away: 52 columns for the weeks of a year and 90 rows for the years of a life. Every row starts on your birthday, so the row labeled 30 is the year you were thirty.
From there you can make it yours:
- Add milestones. Drag across the grid to select a period, or tap a single week. Give it a label and one of eight colors: school, studies, jobs, relationships, children, the cities you lived in.
- Check any week. Tap or click a week to see its dates and how old you were.
- Share or export. Copy a link that contains your grid, or download a PNG with your grid, a legend and the counter.
How many weeks are in 90 years?
There are 4,680 weeks in 90 years when you count 52 weeks per year (90 × 52 = 4,680). That is the size of the grid on this page. Someone who is 30 has used 1,560 of those weeks, someone who is 40 has used 2,080 and someone who is 50 has used 2,600.
| Age | Weeks lived | Weeks left of 4,680 | Share of 90 years |
|---|---|---|---|
| 20 | 1,040 | 3,640 | 22% |
| 30 | 1,560 | 3,120 | 33% |
| 40 | 2,080 | 2,600 | 44% |
| 50 | 2,600 | 2,080 | 56% |
| 60 | 3,120 | 1,560 | 67% |
You can read more about the numbers on how many weeks are in a lifetime, or calculate how many weeks you have lived down to the day.
Why look at a life in weeks?
A year is too big to feel and a day is too small to see. A week is a unit everyone knows from experience: you can remember last week and you can plan the next one. Seeing all of them on one screen makes a life look both longer and shorter than expected. Longer, because 4,680 is a lot of boxes. Shorter, because you can see every one of them at once.
The grid is not meant to be gloomy. Most people use it to look back at what filled their years so far and to decide what deserves the open boxes. If you like the philosophical side, read about the memento mori calendar.
Is my data private?
Yes. My Life in Pixels has no backend and no accounts. The app runs entirely in your browser, stores your grid in localStorage and never sends it to a server. Share links carry the data inside the link itself, after the # sign, which browsers never transmit. Details are on the privacy page.
Frequently asked questions
Is My Life in Pixels free?
Yes. The life grid, the share link and the PNG export are free and will stay free. There are no ads and there is no paid tier hiding the basics. A high-resolution poster export may be added later as a paid extra.
Do I need an account?
No. There is no sign-up, no login and no email address to confirm. You enter a date of birth and the grid appears. Your data is saved in your own browser, so it is still there the next time you visit from the same device.
Where is my data stored?
In your browser's localStorage, on your own device. Your date of birth and milestones are never sent to a server. The "Reset my data" button in the tool removes everything at once.
How does the share link work?
The link contains your grid itself, compressed into the part of the address after the # sign. Browsers never send that part to a server, so your date of birth and milestones do not end up in logs or analytics. Only your name and percentage sit before the # sign, so chat apps can show a preview such as "I'm Bram and I'm at 53% of my life. What about you?" Anyone who has the link can open a read-only copy of your grid.
Can I change the life expectancy of 90 years?
Yes. The grid starts at 90 years, which is 4,680 weeks, and you can set any length from 70 to 100 years. The counter and the percentage follow the length you choose.
Why does the grid have exactly 52 weeks per year?
A calendar year is 52 weeks plus one or two days. The grid leaves those extra days out so that every row starts on your birthday and every year looks the same. Over 90 years the difference adds up to about 16 weeks.
Last updated: