Year in Pixels
Year in Pixels is a mood tracker in which every day of the year is one square, colored by how the day felt. A full year makes a grid of 12 months by 31 days with 365 colored squares. You can print the free template below; a digital version inside My Life in Pixels is planned.
How does a Year in Pixels work?
You draw a grid with the twelve months across the top and the numbers 1 to 31 down the side. Every day gets one square. At the end of each day you color that day’s square according to a legend you chose in January, typically five moods from great to bad.
The format comes from the bullet journal community and is usually credited to Camille of the French blog Passion Carnets. It spread quickly because it takes ten seconds a day and produces something worth looking at: after twelve months, a whole year of your life fits on one page.
How do you use the printable template?
Open the printable Year in Pixels template and print it on A4. It has:
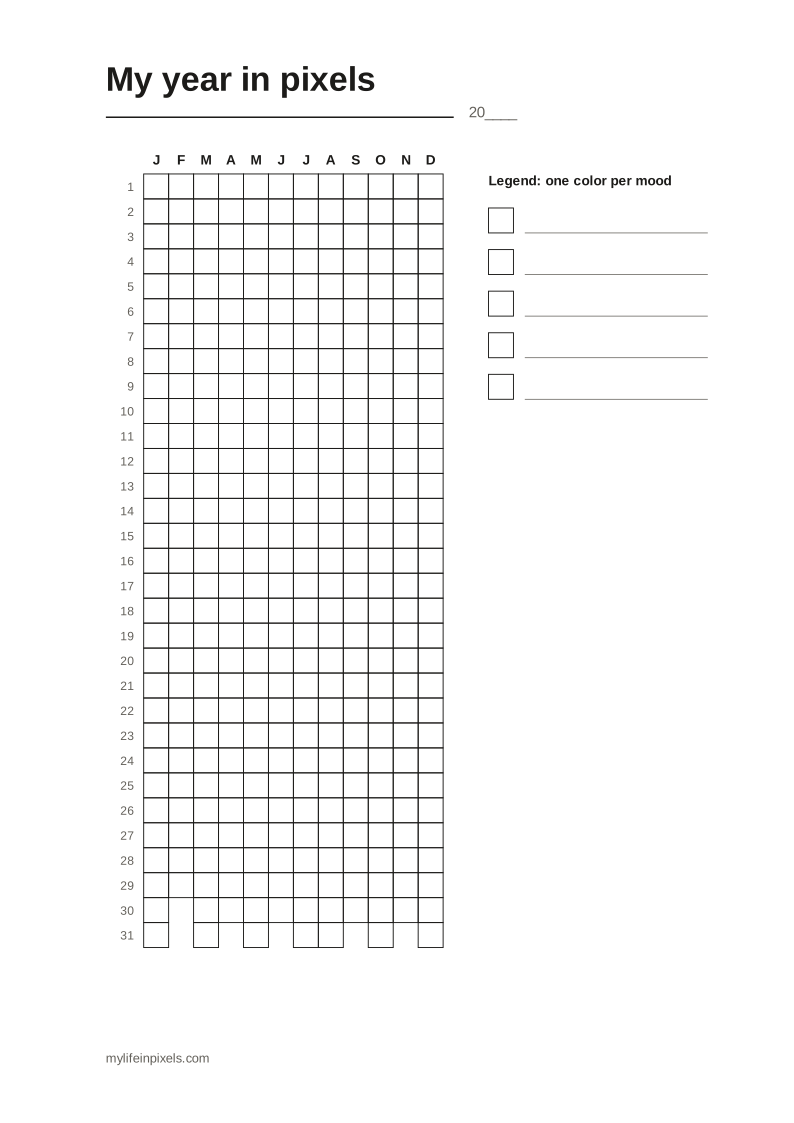
- a grid of 12 months by 31 days, with the days that do not exist left out;
- a legend with five empty boxes for your own colors;
- room for the year at the top.
Pick your colors first and write the mood next to each box. Keep the page where you will see it in the evening, such as inside a journal or on the fridge.
Which colors work best?
Choose colors that are easy to tell apart and that mean something to you. A common scheme runs from warm to cool: yellow for great days, green for good, blue for average, purple for tired or stressed and gray for bad. Avoid two shades of the same color; in December you will not remember which was which.
What do you learn from a year of pixels?
Patterns that are invisible day to day become obvious on a full page. People often notice that bad days cluster around the same weekday, that a difficult month was shorter than it felt, or that a change in job or routine shows up as a change in color. The grid does not explain anything by itself, but it tells you where to look.
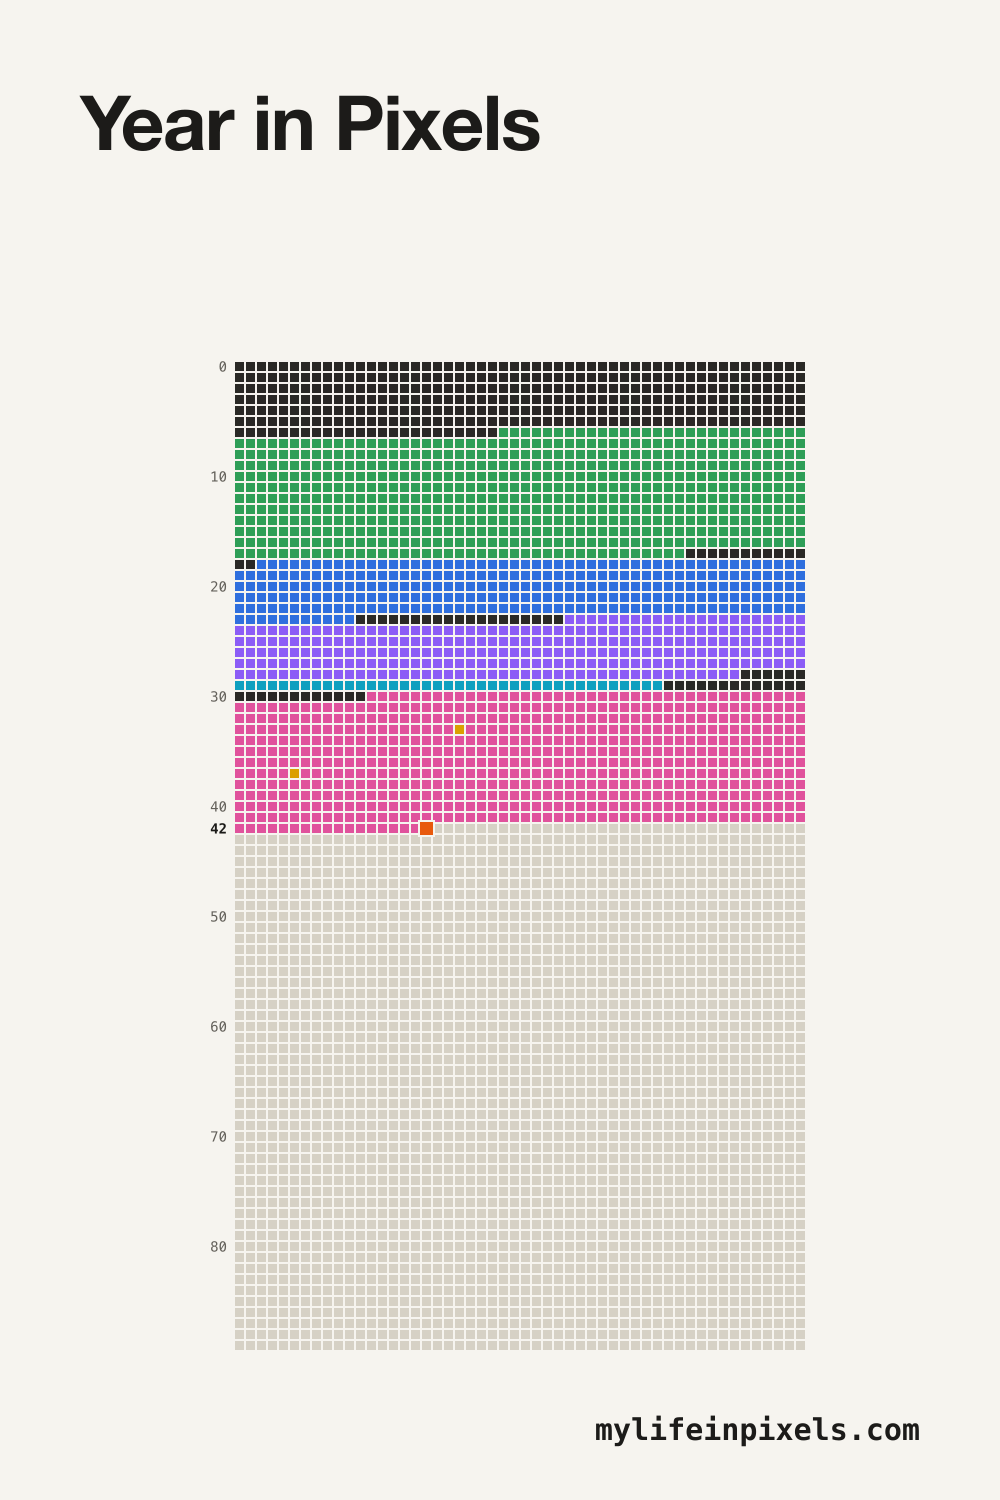
If you want the same overview on a bigger scale, the life grid shows every week of your life, and the memento mori calendar explains the thinking behind it.
Frequently asked questions
How many colors should a Year in Pixels have?
Five is the usual number: for example great, good, average, tired or stressed, and bad. With more than six or seven colors the differences become hard to choose between every evening and hard to read at the end of the year.
What if I miss a day?
Fill it in from memory the next day, or leave the square empty. A few gaps do not spoil the picture, and an empty square is more honest than a guess from two weeks later.
Can I track something other than mood?
Yes. The same grid works for sleep, exercise, headaches, screen-free evenings, reading or weather. Anything you can score once a day with a handful of colors fits the format.
Is there a digital Year in Pixels on this site?
Not yet. A daily mood pixel is planned as an addition to My Life in Pixels. Like the life grid, it will work without an account and keep your data in your own browser.
What is the difference between Year in Pixels and a life calendar?
The scale. Year in Pixels shows one year with one square per day, colored by mood. A life calendar shows a whole life with one square per week, colored by life periods. One is a diary, the other is a map.
Last updated: